At the time we published our questionnaires to near 120 banking app users, we were not certain of what we were to update in the Ulster Bank app. We hoped to confirm or squash our assumptions and findings made during our heuristic evaluations. We fished for insights on banking app user attitudes toward finding opportunities and threats.
Design
I employed mainly multi-choice single answer questions and grading to ease the data analysis. I allowed “Other” on some questions, which enables respondents to add additional options or comments. I also enabled commenting, which I chose not to include as design factors due to the low sample.
I took care to keep within data protection laws and general survey ethics. Cohen, Manion, & Morrison’s, (2000) chapter on questionnaires served as a useful prompt.
Results summary
Our research correlated our respondents’ age against the likelihood of their owning their own property, of having a mortgage, and even when they are likely saving to buy a property. That is likely of great use to our marketing teams and lent less to us in determining task priorities or navigation strategies.
We did identify trends to support our initial assumptions and generalisations. From my own research thread (below):
The feedback
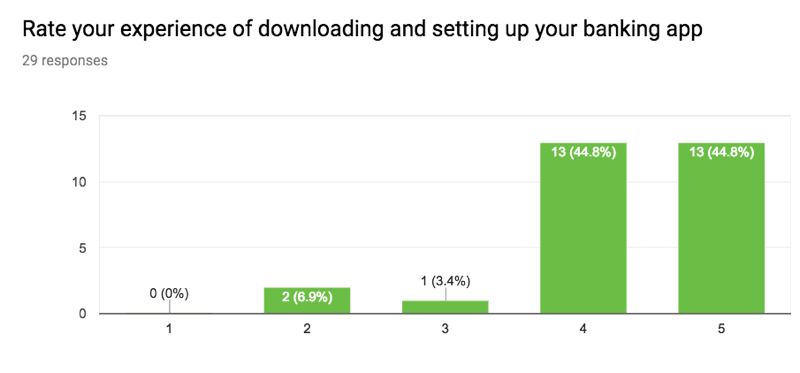
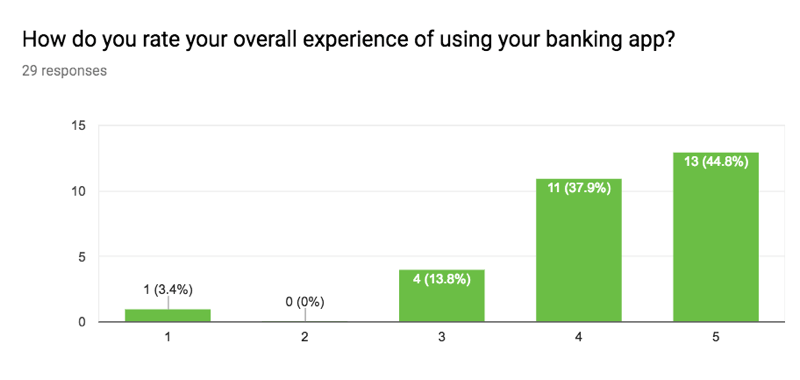
The majority are mostly satisfied with their experience (Figure 1).
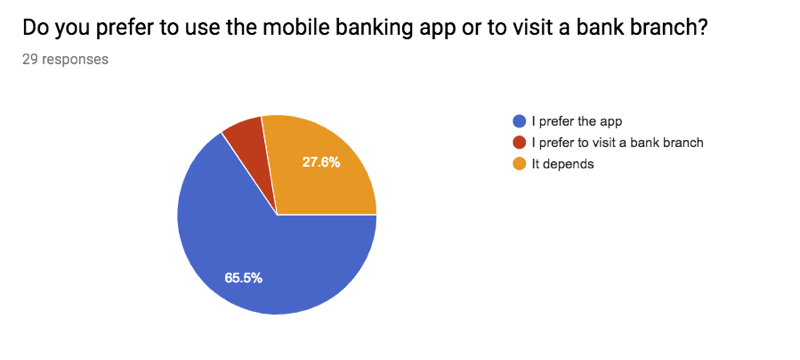
An unexpected result in support of mobile banking apps (Figure 2).
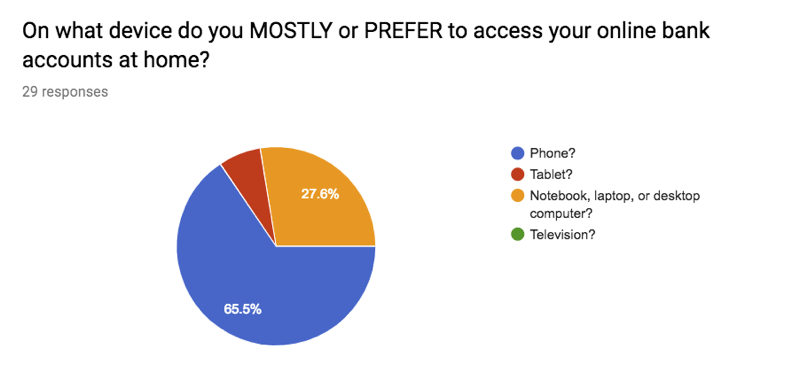
Interestingly, the mobile banking apps do not appear to have conquered the desktop – yet (Figure 3).
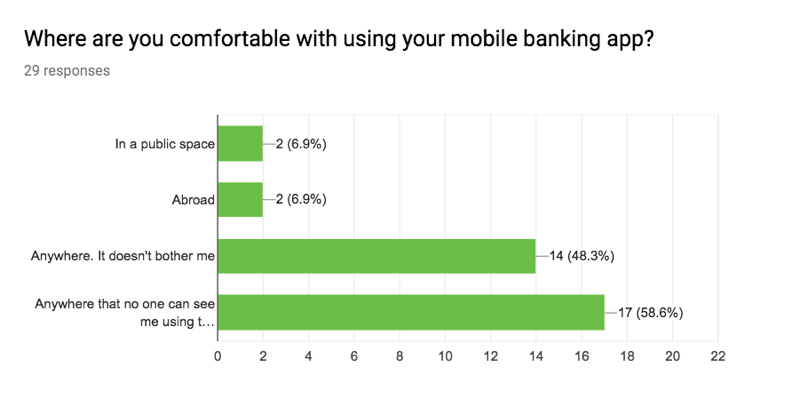
There is clearly a need to consider privacy when banking (Figure 5). Social stigmas, fear of being targeted for handsome, or only politeness aside, there is an opportunity to introduce a privacy setting.
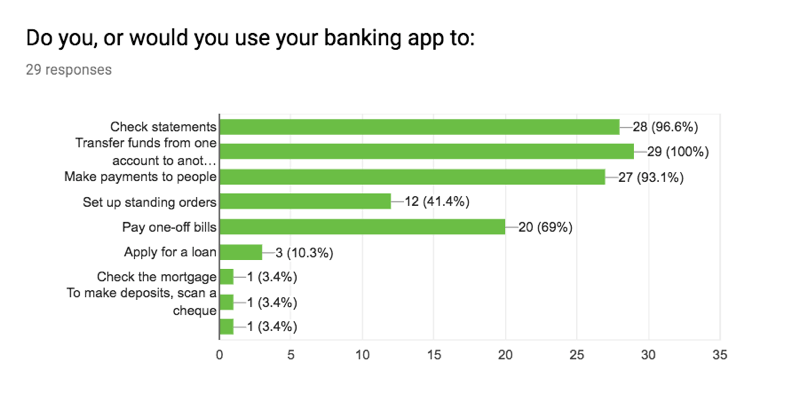
Most app use in this survey appears to be to check statements, transfer funds from account to account, and to pay someone (Figure 6). This may be why Ulster Bank promoted the three tasks on the homepage: click the card to drill into to the account detail, Pay, and Transfer links?
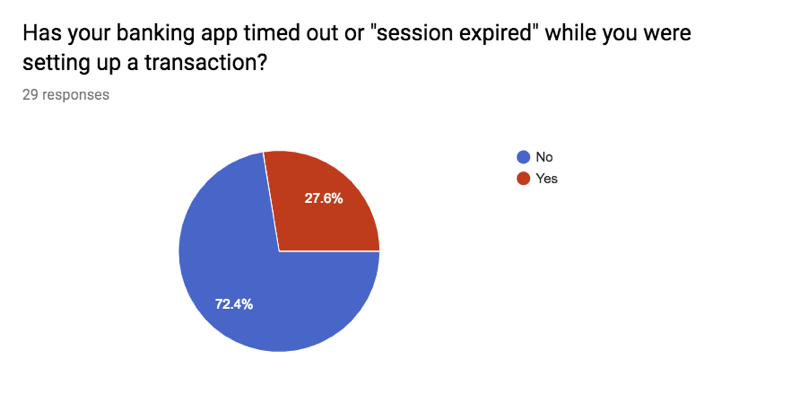
27% is significant (Figure 7), regardless of the overall satisfaction reported at Figure 8.
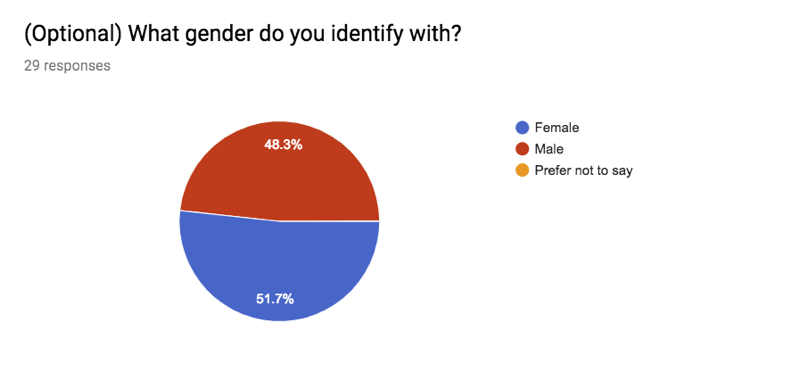
A near 50/50 split in gender (Figure 10)? This may relate to the business group I asked to participate being mostly female?
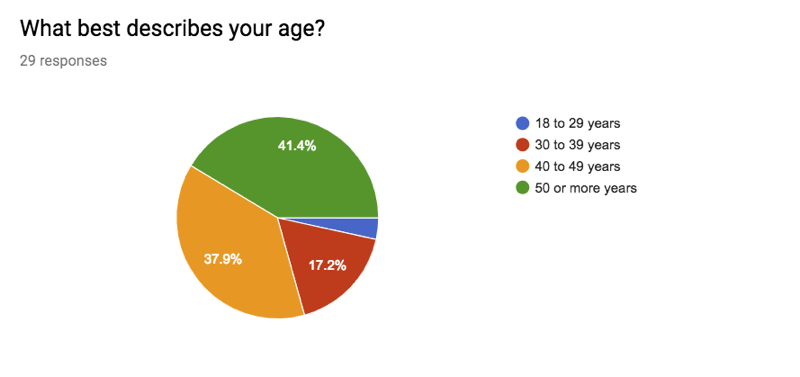
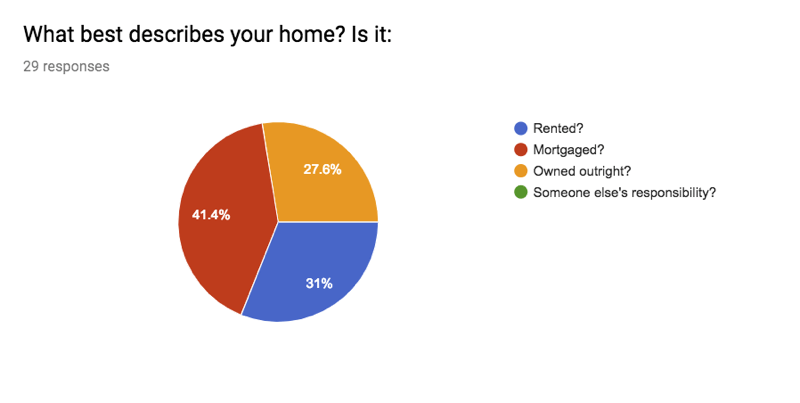
Although employing an unreliable technique of Thumb, correlating this data (Figure 12) with that of our respondents’ age (Figure 9) matches our assumptions about achieving lifetime landmarks and age groups.
References
Cohen, L., Manion, L., and Morrison, K. (2000). Research Methods in Education (5th Edition). New Yor, NY: RoutledgeFalmer.